PILIER 2 — GÉOSPATIAL APPLICATIONS
Du terrain à la décision
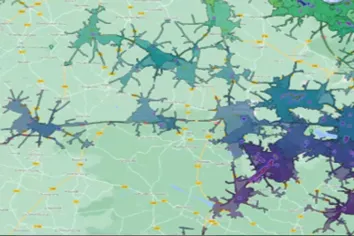
Intelligence territoriale appliquée aux enjeux de déploiement
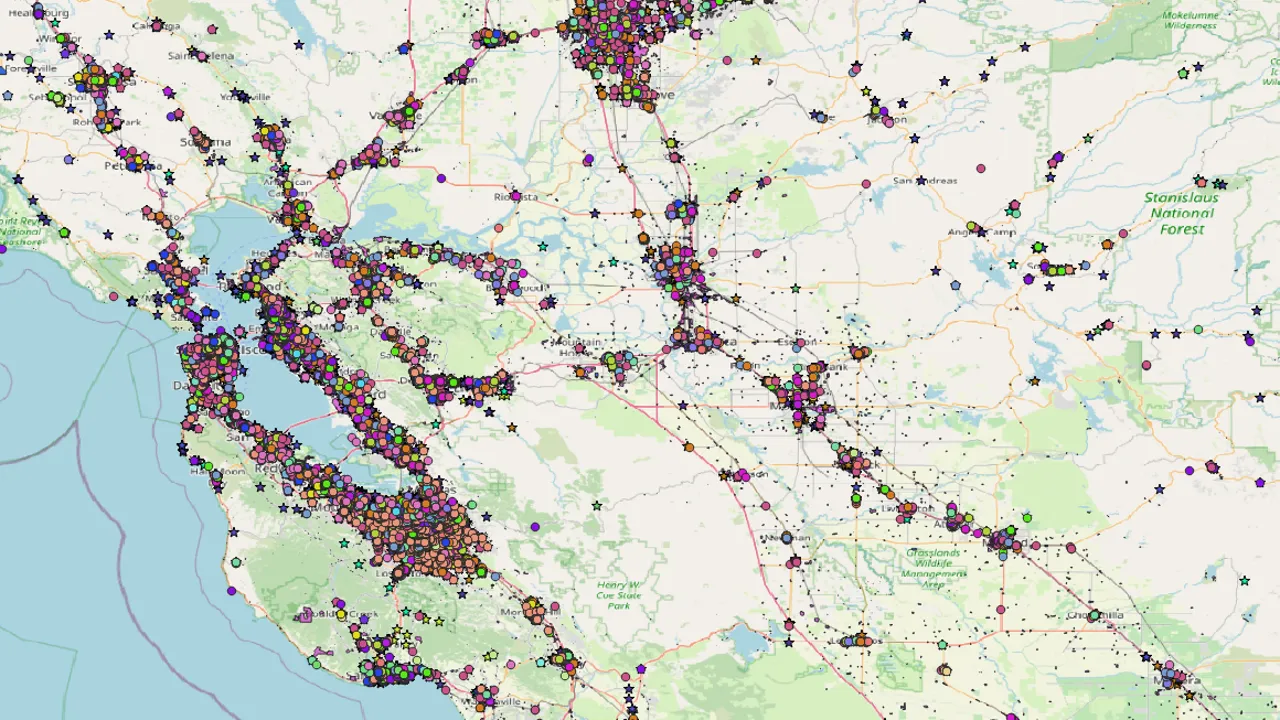
Comprendre son marché
Cartographier les zones où se recoupent vos facteurs de succès, en définissant les critères de décision et en structurant la donnée, pour cibler les territoires où scaler vite, avec un maximum d’impact et un minimum de risque.
Définir sa stratégie
Prioriser les zones, séquencer les investissements et gérer les risques avec l'analyse géospatiale prédictive.
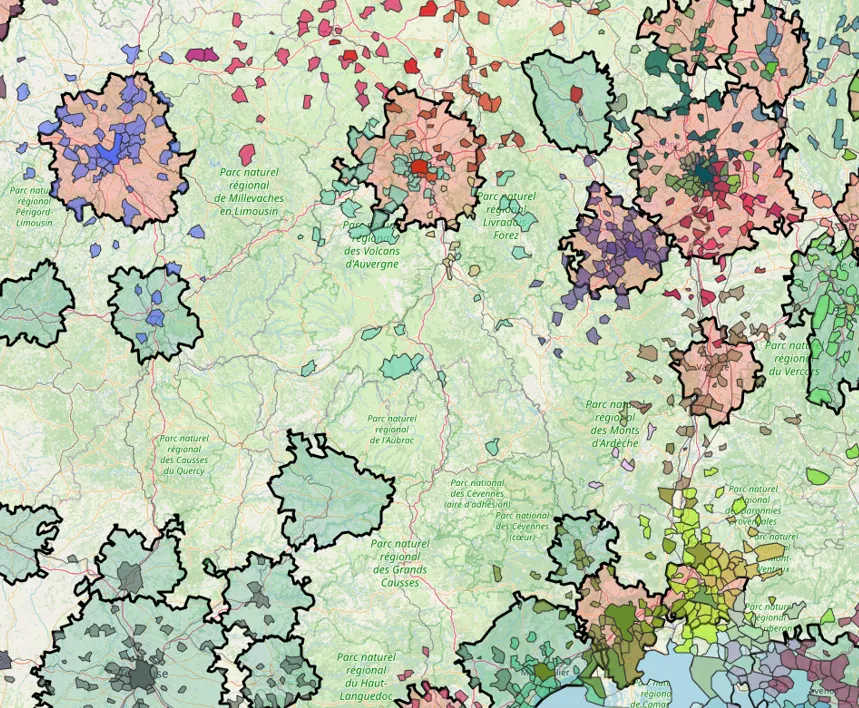
Identifier les opportunités
Détecter les zones blanches et évaluer le potentiel de développement avec des SIG et du scoring territorial.